Exercise 1: Acetic Acid
Hirshfeld surfaces, hydrogen bonding and electrostatics
Initial Surface Generation
- Open the ACETAC07 CIF
 , select
the molecule and generate the Hirshfeld surface (HS)
, select
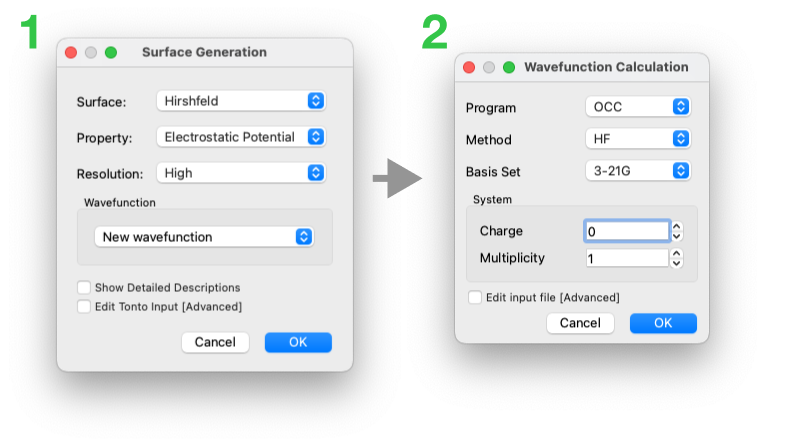
the molecule and generate the Hirshfeld surface (HS) 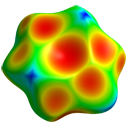 ,
with a HF/3-21G electrostatic potential (using Tonto) mapped on the surface.
,
with a HF/3-21G electrostatic potential (using Tonto) mapped on the surface.
Fingerprint Plot Analysis
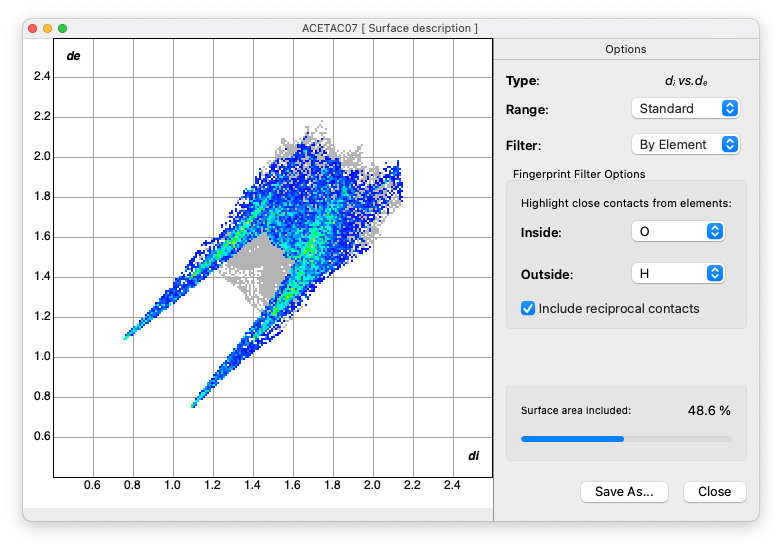
- Generate the 'Fingerprint Plot'
 and explore its characteristics:
- Use the Filter option to identify regions associated with specific atom···atom contacts (e.g. O···H and H···O separately)
- Examine the patterns and features in the plot
Surface Properties
- On the same surface, view some the default properties mapped on the same surface:
- 'Fragment Patch'
- 'Shape Index'
- 'Curvedness'
tip
Cycle through these one by one using the Surface dialog at bottom right of the graphics window. For each property, note the minimum/maximum values provided. You can also access surface area and volume for this HS this way.
Fragment Patch Analysis
- The 'fragment patch' property is useful for identifying how many molecules (actually other surfaces) are in contact with the HS (effectively the first coordination sphere):
- Click on the Information icon
 to reveal:
- Details on various surface properties
- Summary of atom···atom breakdowns for the fingerprint plot
- Areas of each fragment patch
- Additional analytical information
- Click on the Information icon
Electrostatic Potential Analysis
- Return to the electrostatic potential surface and:
- Rescale the surface property to limit the range to ±0.025 au
- This highlights regions of:
- Strong electronegative (red) character
- Strong electropositive (blue) character
note
Enable surface transparency to better see the molecular structure beneath the surface
Interaction Analysis
- To identify interactions:
- Right-click on specific faces of the HS
- Select Generate External Fragment to examine the interaction with the carboxylic acid group
- Note: This structure shows hydrogen bonded chains (catemer motif) rather than the typical cyclic dimers found in many carboxylic acids
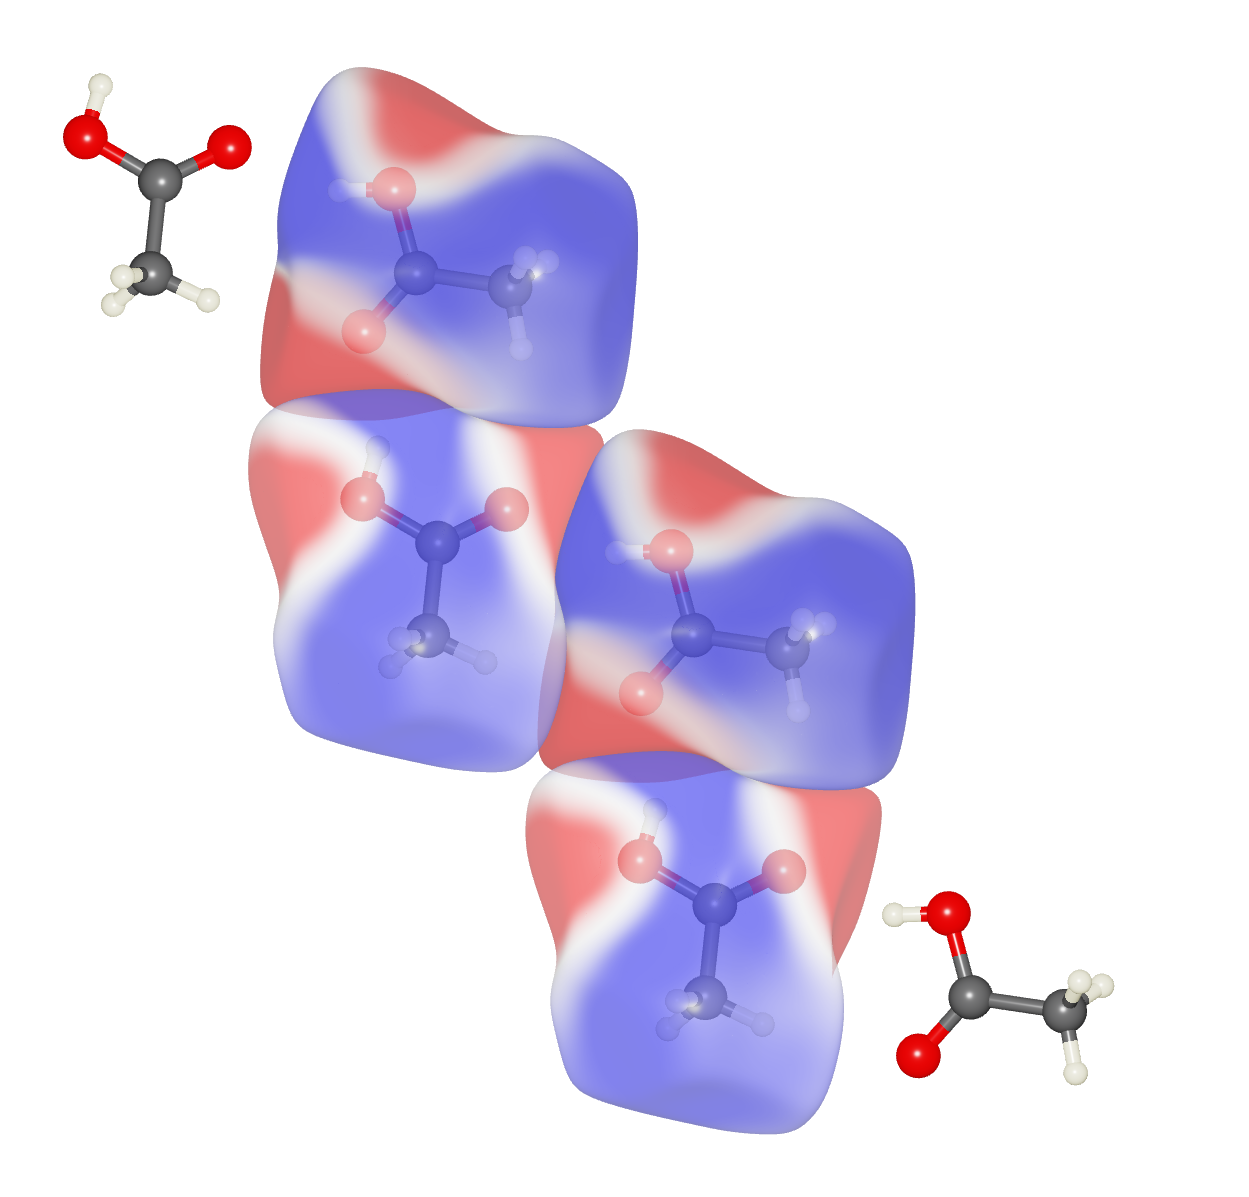
- Use Clone Surface
 to create a chain of molecules/surfaces linked in this manner:
Interesting Observation
Look for the strong pattern of electrostatic complementarity between adjacent hydrogen-bonded molecules (red regions in one molecule adjacent to blue regions of its neighbour, and vice versa).
Surface Management
- Managing surfaces:
- Deselect individual surfaces by clicking on the ticks beside the surfaces
- Note the hierarchy of surfaces:
- Parent surface
- Clones (related by specified symmetry operations)
- Deselect the parent surface to remove all surfaces
- Use the Display menu to show Hydrogen Bonds
Energy Calculations
- For energy analysis:
- Right click on the graphics window background
- Select Reset Crystal to return to a single molecule
- Use Show/Hide contact atoms
 to:
to:
- Generate neighbouring atoms
- Select the hydrogen-bonded molecule
- Remove remaining contact atoms
- Calculate interaction energies:
- Select one or both molecules
- Click Calculate Energies

- Select Energies from user-defined wavefunction
- Expected result: -33.8 kJ/mol
- Examine the energy breakdown in the Information dialog:
- Electrostatic component
- Dispersion component
- Other energy terms
caution
Consider whether these energies are meaningful to within 1 kJ/mol
Cluster Analysis
- For analyzing multiple molecular pairs:
- Select a molecule
- Use Generate Atoms within Radius
 (default 3.8 Å)
 - Complete all fragments

- Calculate energies for all 7 unique molecular pairs
- Note the color-coding in the graphics window
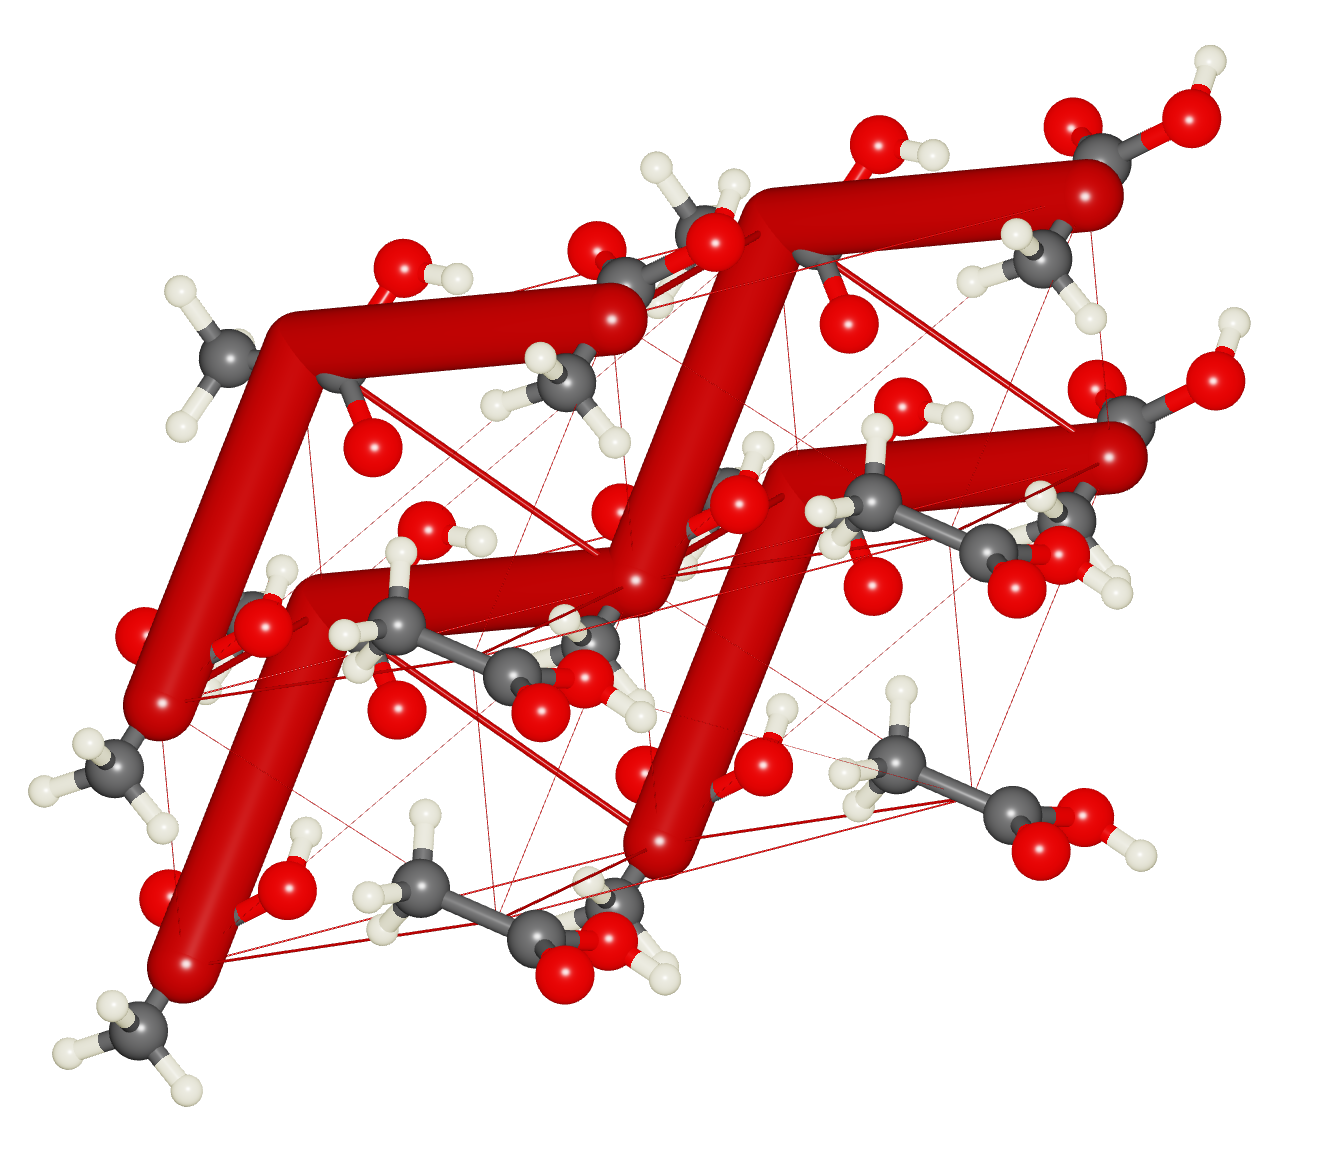
Energy Frameworks
- Create energy frameworks:
- Select Display / Energy frameworks
- Examine different energy diagrams:
- Coulomb Energy ()
- Dispersion Energy ()
- Total Energy ()
- Use Show Options to customize the display
Lattice Energy Calculation
- Calculate lattice energy:
- Use the Information / Energies window
- Multiply the and columns (vector product)
- Divide by 2
- For 3.8 Å cluster: -62.6 kJ/mol
- For 8 Å cluster (32 unique pairs): -70.4 kJ/mol
Comparison with Experimental Data
Compare your calculated results with the experimental sublimation enthalpy (~70±1 kJ/mol). The agreement is surprisingly good and will be explored further in Exercise 6.