Fingerprint Plots
Displaying Fingerprint Plots 
To display a fingerprint plot1, first select a Hirshfeld surface (in the surface list) and then click on the Display Fingerprint Plot button.
This button is located in the Surface Controller in the bottom right of the CrystalExplorer window.
The fingerprint window includes options for,
- Translating or expanding the fingerprint plot to cater for structures with longer distance contacts.
- Saving the fingerprint plot (Tip: For best reproduction save the fingerprint as an .eps file).
- Creating filtered fingerprint plots.
Filtered fingerprint plots
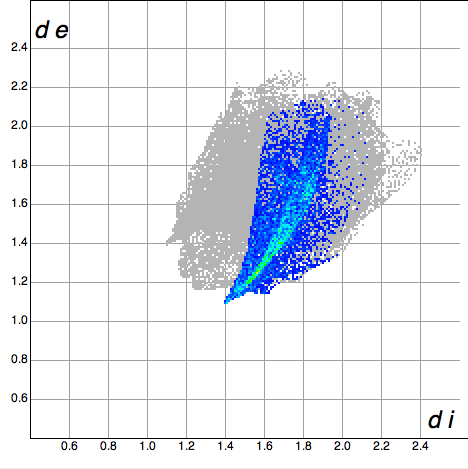
Filtered fingerprint plots2 are produced by applying a filter to highlight only close contacts between pairs of atoms of particular chemical elements. Only contributions from those contacts are shown in the fingerprint plot, with the rest greyed out.
By clicking on the fingerprint plot, highlight "cones" can also be displayed on the Hirshfeld surface showing which points on the surface correspond to a certain di/de pairs
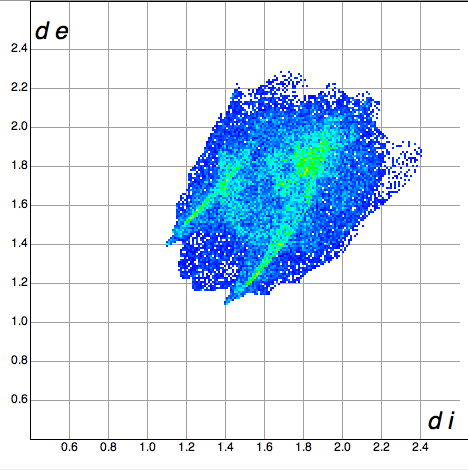
Fingerprint plot of benzene-dicarbaldehyde with no close contact filtering:
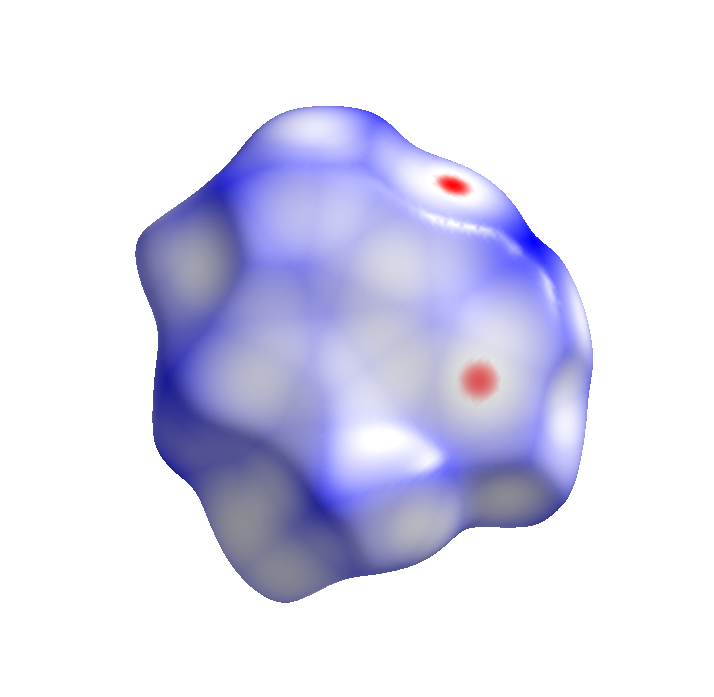
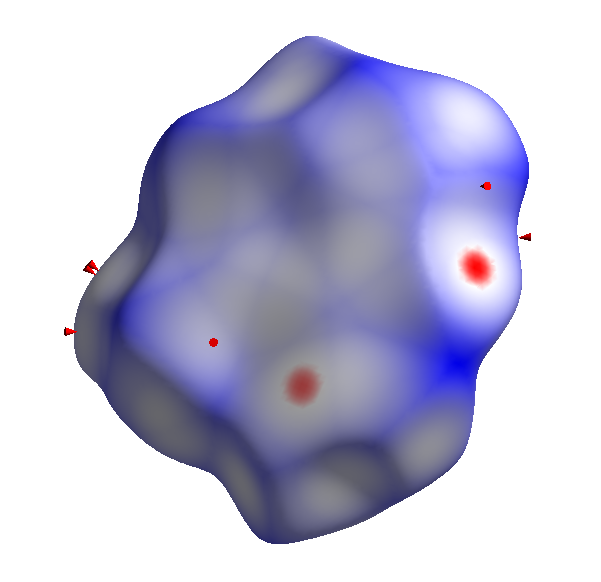
Hirshfeld surface of benzene-dicarbaldehyde with no close contact filtering
Filtered fingerprint plot with close contacts shown for O atoms inside the surface and H atoms outside
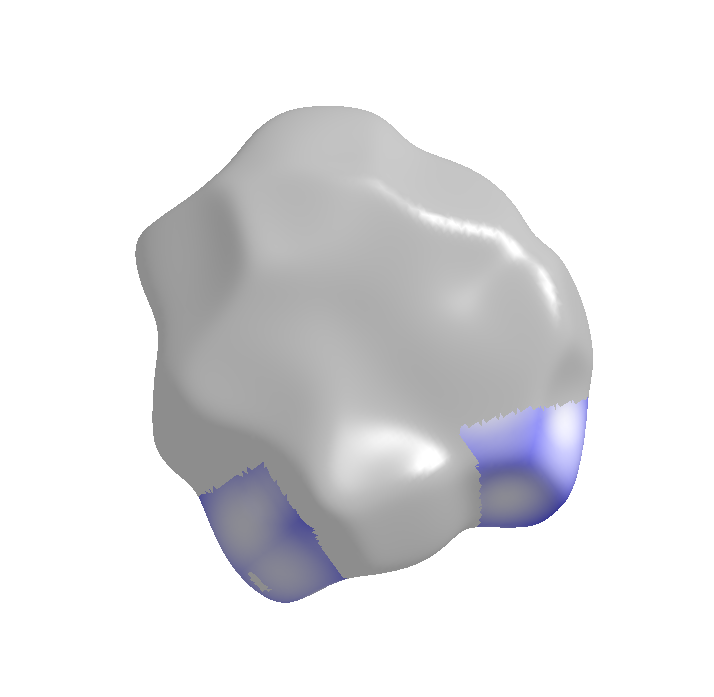
Close contact decomposition mapped onto the Hirshfeld surface
Highlight "cones" on Hirshfeld surface produced by clicking on the fingerprint plot.
The cone color can be changed in the Graphics tab of the CrystalExplorer Preferences dialog.
Footnotes
-
M.A. Spackman, J.J. McKinnon, CrystEngComm, 2002, 4 ,378-392 Fingerprinting Intermolecular Interactions in Molecular Crystals ↩
-
J.J. McKinnon, D. Jayatilaka, M.A. Spackman, Chem Commun., 2007 ,3814 - 3816 Towards quantitative analysis of intermolecular interactions with Hirshfeld surfaces ↩